|
|
| Download | |
| Batch | Batch convert images |








|
|
| Edit | |
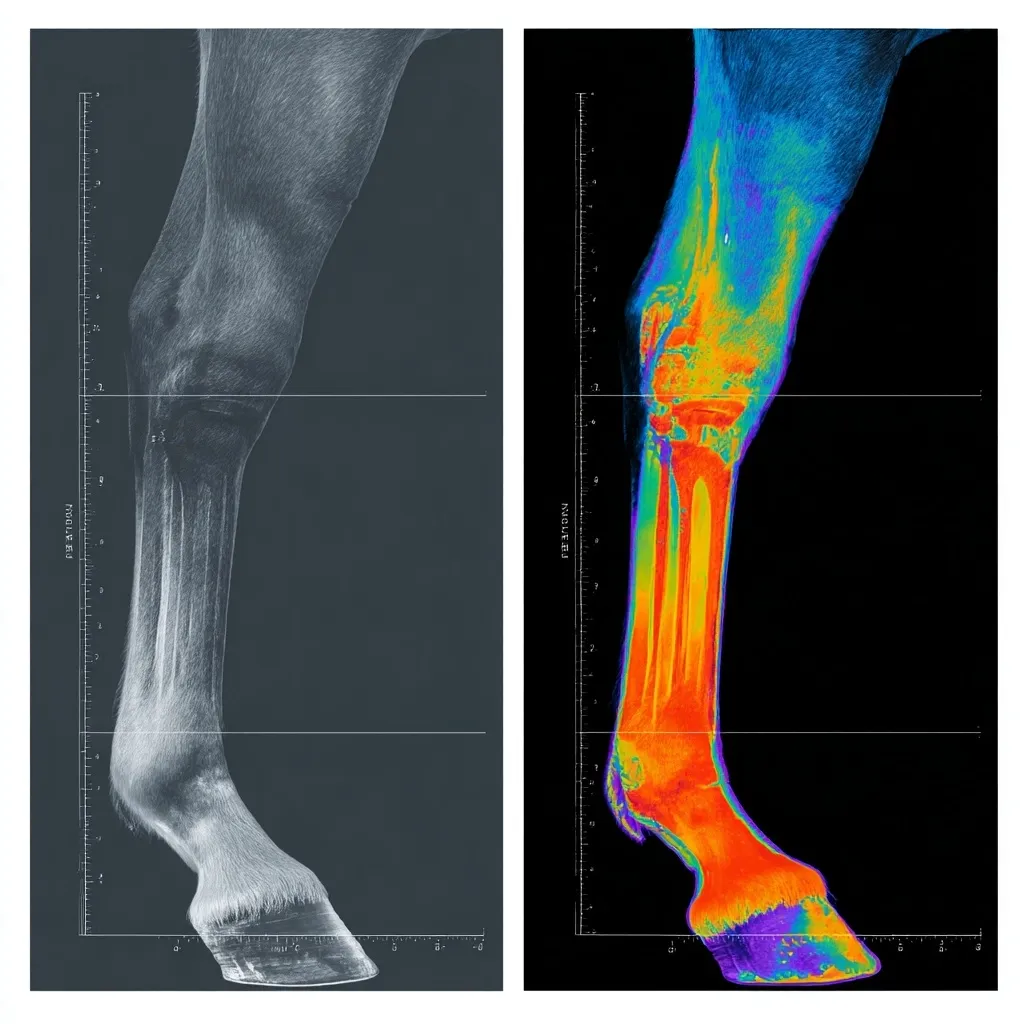
| title | Comparison of horse leg X-ray and thermographic scan images. |
| description | A side-by-side comparison of a horse's leg. The left image is a grayscale X-ray, showing the bone structure and soft tissue. The right image is a thermographic scan, displaying a color-coded heat map representing temperature variations in the leg. Both images are scaled and provide a detailed view from the fetlock to the hoof. The thermogram highlights potential areas of inflammation or injury not as readily apparent in the X-ray. |
| resolution | 1024x1024 |
| creativity | |
| likes | 100 |
| from | Click to get the source of image (1024 x 1024) |
| Model | Midjourneyv7 |
| Fine tuning | |
| LoRA | |
| prompt | comparison image: horse leg thermal scan before and after therapy, labeled temperature gradient map, medical data visualization, scientific layout --v 7.0 |
| negative prompt | |
| parameters | |