|
|
| 下載 | |
| 批量 | 批量轉換圖片 |








|
|
| 編輯 | |
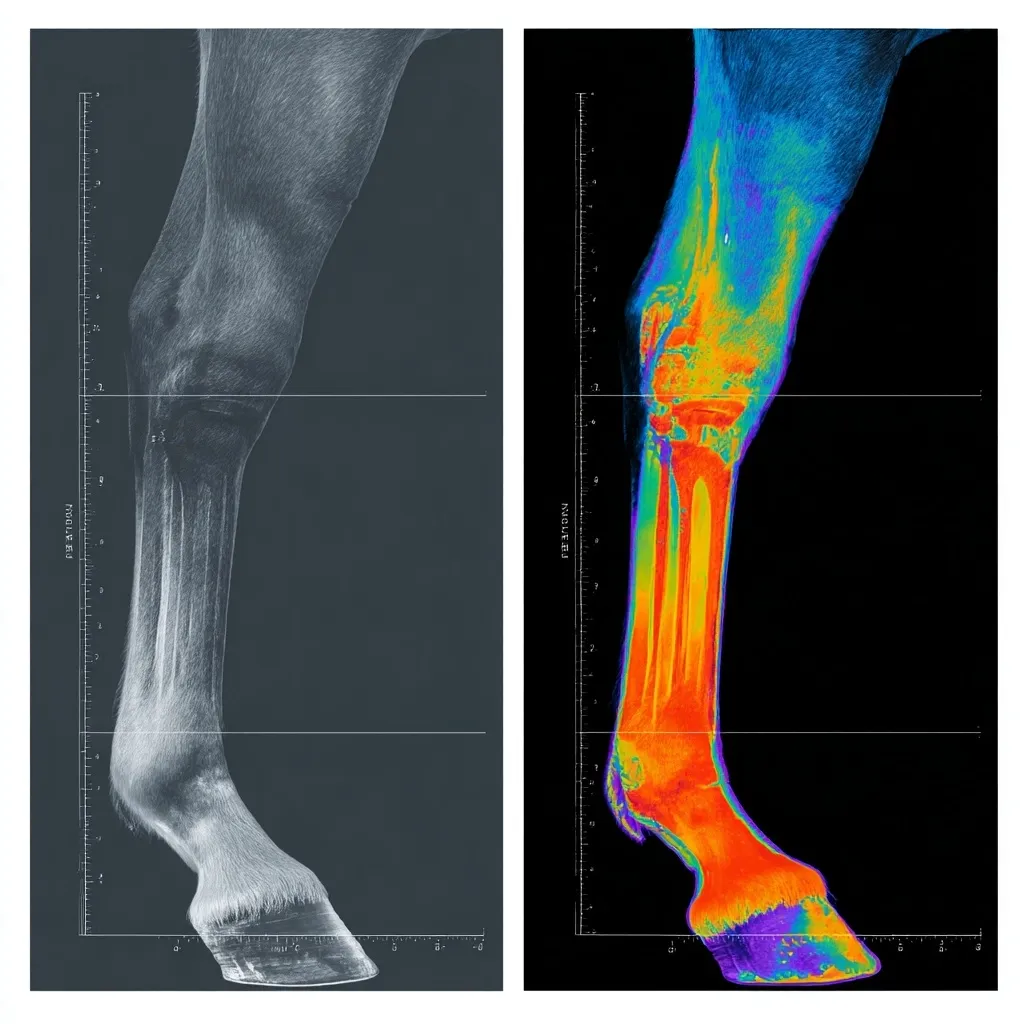
| 標題 | Comparison of horse leg X-ray and thermographic scan images. |
| 描述 | A side-by-side comparison of a horse's leg. The left image is a grayscale X-ray, showing the bone structure and soft tissue. The right image is a thermographic scan, displaying a color-coded heat map representing temperature variations in the leg. Both images are scaled and provide a detailed view from the fetlock to the hoof. The thermogram highlights potential areas of inflammation or injury not as readily apparent in the X-ray. |
| 解析度 | 1024x1024 |
| 創意 | |
| 喜歡 | 100 |
| 來自 | 點擊取得圖片的来源 (1024 x 1024) |
| 模型 | Midjourneyv7 |
| 微調 | |
| LoRA | |
| 提示词 | comparison image: horse leg thermal scan before and after therapy, labeled temperature gradient map, medical data visualization, scientific layout --v 7.0 |
| 負面提示词 | |
| 參數 | |